Small businesses today swim through oceans of data yet struggle to fish out meaningful insights. Founders know they need to track performance, but many don’t track metrics at all or get stuck juggling spreadsheets, waiting on reports, and making decisions with outdated numbers. This disconnect between having data and using it effectively creates a costly gap in modern business operations.
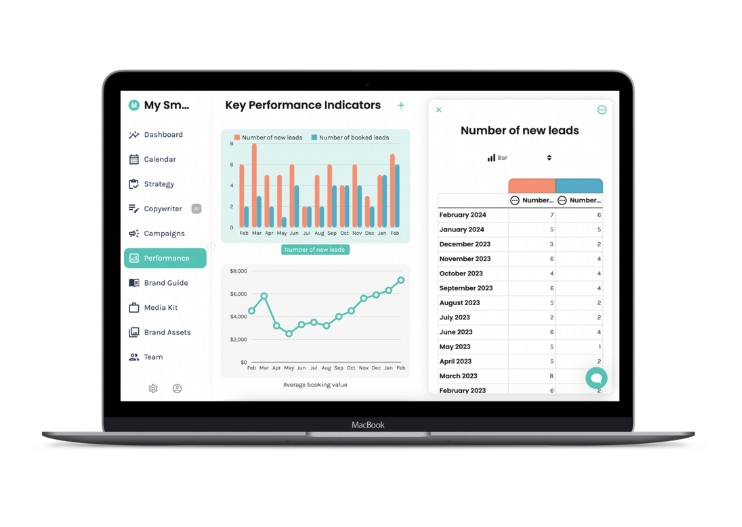
The Enji KPI Dashboard bridges this gap by transforming raw metrics into actionable intelligence for businesses ready to start tracking their performance. Visualization tools and KPI dashboards don’t just present numbers; they reveal the story behind the data. When business owners can see performance trends over time, they make smarter, more informed decisions that keep companies competitive in rapidly changing markets.
Let’s explore how building a monthly KPI review into your small business processes can improve your sales and marketing and why this has become essential for companies wanting to stay ahead of the curve.
The Data Decision-Making Crisis
Creative solopreneurs wait weeks for campaign results. Freelance consultants can’t spot troubling trends until the month-end reviews. Service-based business owners struggle to provide timely insights to their clients. Meanwhile, opportunities vanish and problems grow.
Many solopreneurs don’t track any metrics at all, flying blind through their business operations. Those who do track data often cobble together reports from different systems. Data silos mean the sales funnel doesn’t reflect what customer feedback reveals. Making decisions without consistent data tracking is like driving without a map.
What Makes an Effective KPI Dashboard
A truly effective dashboard goes far beyond colourful charts and basic metrics. It transforms complex data relationships into intuitive visuals that trigger immediate understanding and action.
Good dashboards strike a delicate balance between simplicity and depth. They present high-level indicators for quick assessment while allowing users to drill down for details when needed. They avoid data overload but never oversimplify complex realities.
Customization proves critical since different creative businesses need different insights. Freelance designers require project profitability metrics, while consultants focus on utilization rates. Content creators track engagement metrics, while service providers monitor client satisfaction and cash flow. The most successful implementations tailor views to each solopreneur’s specific business needs.
Color psychology plays a subtle but important role too. Effective dashboards use consistent color coding to signal performance status, creating instant recognition patterns. Red indicators grab attention when KPIs drop below targets, while green trending lines reassure when growth continues.
The best dashboards don’t just report history; they help identify patterns and suggest next actions based on monthly trends in the data.
Implementation Success Factors
Successful dashboard implementations focus on adoption as much as technology. The most beautiful dashboards fail when solopreneurs don’t use them consistently.
Start with clear objectives rather than tracking everything possible. Define the 5-7 most crucial metrics for your creative business before building complex dashboards. Simple starting points drive faster adoption and clearer insights.
Avoid common pitfalls like disconnected data sources that require manual updates. Automated data connections ensure dashboards stay current with monthly updates without constant intervention. Also, watch for excessive complexity that creates overwhelm for busy solopreneurs who are just starting to track metrics.
Creating a data-driven mindset means incorporating dashboard insights into monthly workflows and client conversations. Successful creative businesses make monthly dashboard reviews part of standard routines and use insights to guide strategic decisions. Adjusting sales and marketing to get rid or fix things that are not working and accelerating on things that are working are the keys to small business success.
Additionally, regular review of dashboard performance helps refine which metrics matter most. What seemed important initially might prove less relevant as the business evolves, so flexibility in dashboard design supports long-term success.
The Future of Business Intelligence
KPI dashboards have transformed how leading small businesses make decisions. By connecting business owners to consistent performance data, these visualization tools eliminate guesswork and help establish better decision-making habits across all business functions.
Creative entrepreneurs should assess their current visibility capabilities honestly. Do you track any metrics at all? Are decisions based on gut feeling rather than data? Do you spend hours assembling reports instead of focusing on creative work? Does information flow clearly between different aspects of your business?
Enji addresses these challenges by centralizing metrics, automating monthly updates, and providing customized views for different creative business needs. With proper implementation, solopreneurs gain not just prettier charts but fundamentally improved decision-making capabilities and the foundation for data-driven growth.
As markets move faster and competition intensifies, the ability to act on consistent monthly data rather than pure intuition will separate tomorrow’s successful creative businesses from those left behind. Monthly business intelligence isn’t just a technological upgrade; it’s a competitive necessity for modern solopreneurs ready to grow beyond guesswork.